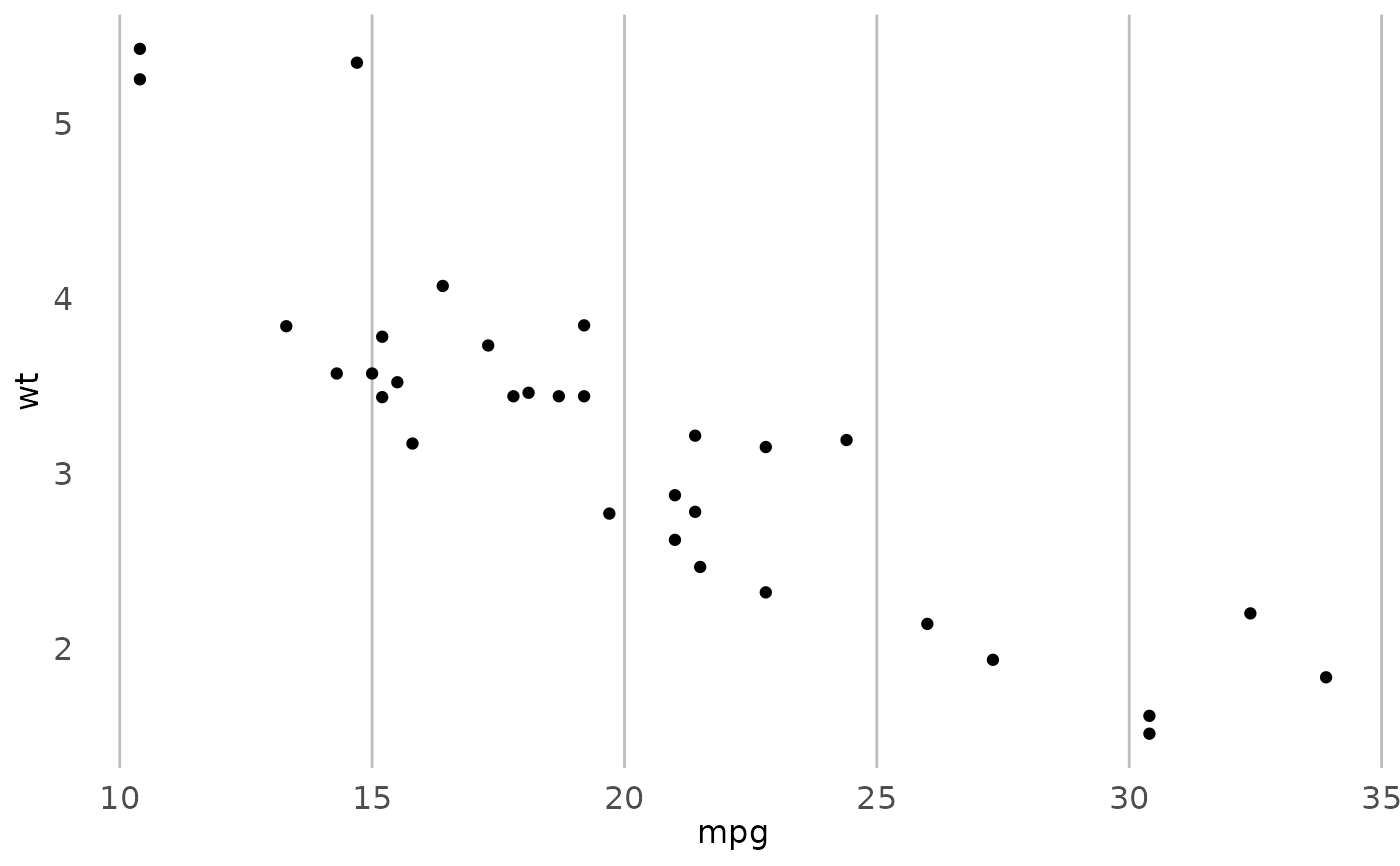
This adds certain styles to ggplot2 charts that conform with Public Health Scotland style guidelines.
Examples
ggplot2::qplot(mpg, wt, data = mtcars) + theme_phs()

This adds certain styles to ggplot2 charts that conform with Public Health Scotland style guidelines.
ggplot2::qplot(mpg, wt, data = mtcars) + theme_phs()
