Continuous colour scales for PHS
Source:R/scale_colour_continuous_phs.R
scale_colour_continuous_phs.RdThe default continuous colour scale for use in PHS
scale_colour_continuous_phs(
  ...,
  type = "seq",
  palette = 1,
  direction = 1,
  values = NULL,
  space = "Lab",
  na.value = "grey50",
  guide = "colourbar",
  aesthetics = "colour"
)
Arguments
- ...
Additional parameters passed on to the scale type
- type
"seq" (sequential). Please see
phs_palette_typesfor more details.- palette
a number describing which palette to use within that type. Defaulted as 1 referring to the first palette "main-purples" in type "seq". It can also be the actual name of the palette e.g. main-purples. Please see
phs_palettesfor more details.- direction
either be 1 (following the palette order) or -1 (reversing the palette order). Defaulted as 1.
- values
if colours should not be evenly positioned along the gradient this vector gives the position (between 0 and 1) for each colour in the colours vector.
- space
colour space in which to calculate gradient. Must be "Lab" - other values are deprecated.
- na.value
Missing values will be replaced with this value.
- guide
A function used to create a guide or its name. Defaulted as "colourbar".
- aesthetics
defaulted as "colour"
Details
There are a list of continuous colour scales using interpolated method that can be used for PHS charts, such as interpolating colours for main-purples which contains phs-purple, phs-purple-80, phs-purple-50, phs-purple-30 and phs-purple-10.
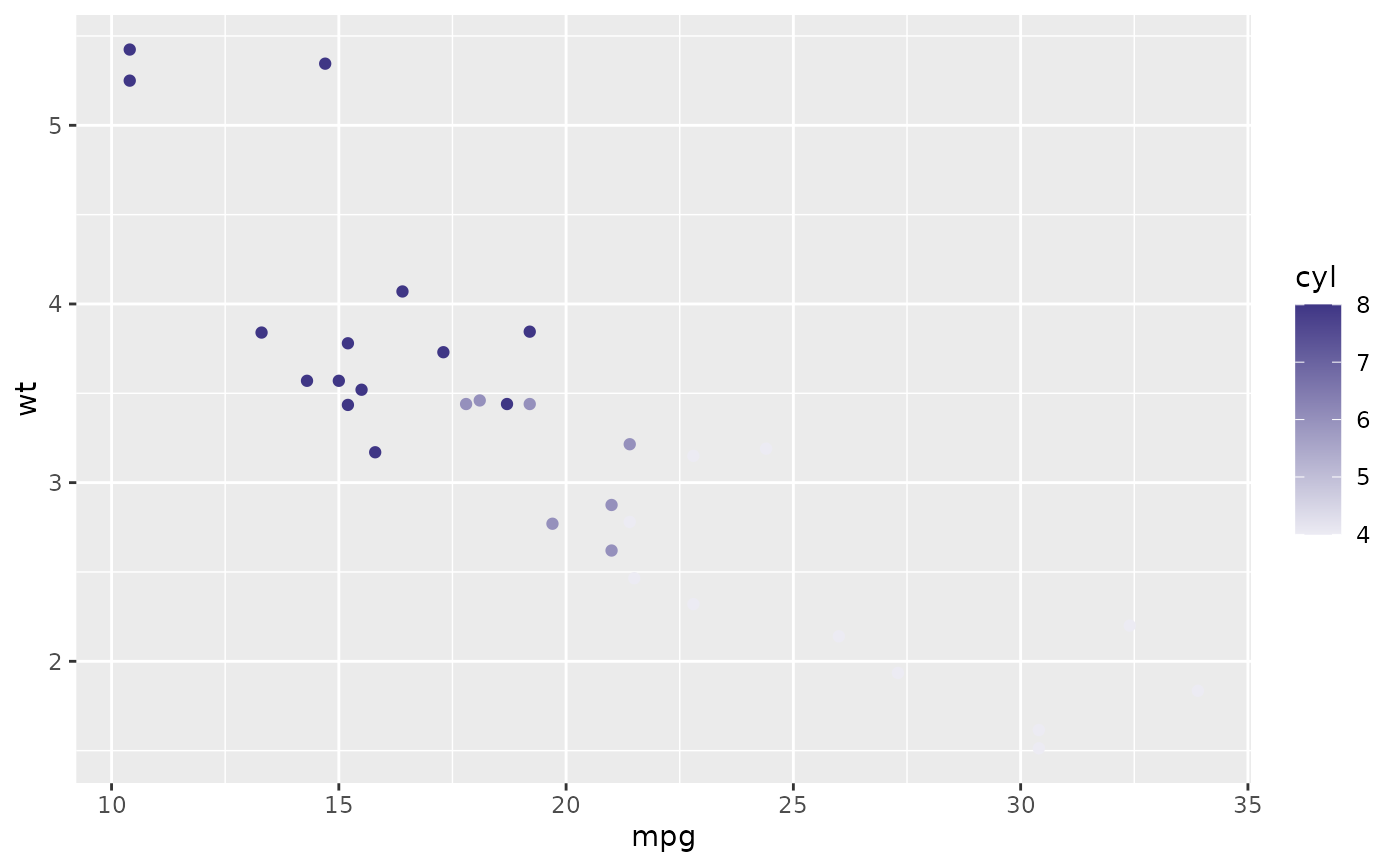
Examples
ggplot2::qplot(mpg, wt, data = mtcars, colour = cyl) +
  scale_colour_continuous_phs(palette = "main-purples")
#> Warning: `qplot()` was deprecated in ggplot2 3.4.0.